Access to investment capital is something that every startup community is trying desperately to improve and we all know the old axiom that you only improve the things you measure. With that in mind, I've done some research and created a baseline of investments raised by Iowa companies over the last five years.
Measuring dollars invested, particularly in a specific geography, turns out to be a pretty tough task and there are a number of ways to go about it. Unfortunately, none of them are exact or exhaustive. For the purposes of this post (and future ones in this series), I've chosen to use publicly available SEC filings (as available online at places like formds.com). This was suggested by Tom Chapman of Chapman and Company, LLC in Omaha who has been analyzing similar data for the Nebraska software ecosystem for years. Tom refers to metrics like this as "truish" noting that they'll always be inexact and have issues with "reporting bias and problems with ecosystem level choices (LLC vs. C-Corps, to file a Form D or not, etc.)".
With that in mind, I asked Bill Daly, an attorney with Shuttleworth & Ingersoll in Cedar Rapids, to help me understand the Form D and when it is used. He wrote a post to explain just that here. Like Tom, Bill notes that Form D information is not a perfect measure of investment activity.
Investments reported: 2010-2015
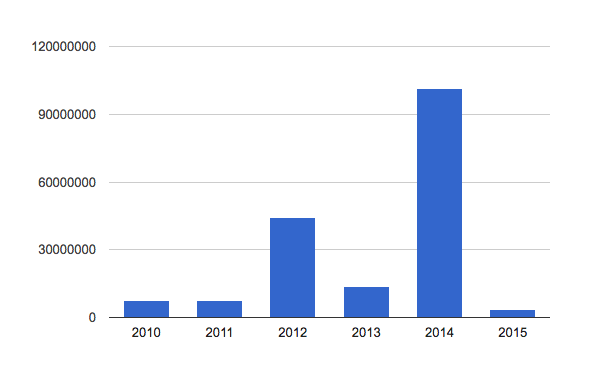
The following information is data pulled from those Form D's that has been refined to mostly represent the software companies (I've removed investments reported by data centers, energy companies, real estate firms, etc.). In the cases where an amended Form D is filed in a different year than the original Form D, the dollars have been moved to the year of the amended filing.
2010
- Total reported: $7,465,665
- Total companies reporting: 5
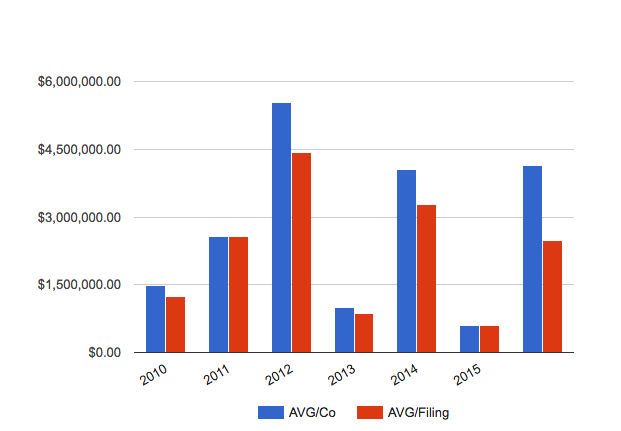
- Average amount per company: $1,493,133
- Number of filings: 6
- Average filing: $1,244,277.50
2011
- Total reported: $7,682,502
- Total companies reporting: 3
- Average amount per company: $2,560,834
- Number of filings: 3
- Average filing: $2,560,834
2012
- Total reported: $44,294,190.00
- Total companies reporting: 8
- Average amount per company: $5,536,773.75
- Number of filings: 3
- Average filing: $4,429,419.00
2013
- Total reported: $13,836,617
- Total companies reporting: 14
- Average amount per company: $988,329.79
- Number of filings: 16
- Average filing: $864,788.56
2014
- Total reported: $101,344,661
- Total companies reporting: 25
- Average amount per company: $4,053,786
- Number of filings: 31
- Average filing: $3,269,183
2015
- Total reported: $3,626,963
- Total companies reporting: 6
- Average amount per company: $604,493.83
- Number of filings: 6
- Average filing: $604,493.83
2010-2015
- Total reported: $178,250,598
- Total companies reporting: 43
- Average amount per company: $4,145,362.74
- Number of filings: 72
- Average filing: $2,475,702.75
Geoff Wood is the founder, connector and space captain at Gravitate, a workplace community for entrepreneurs, freelancers and remote workers in the heart of downtown Des Moines. In addition to writing here, he hosts a podcast, speaks at conferences, organizes events and has been helping tell the story of the Iowa startup community since 2009.